Breakpoints
Breakpoints (🏁 solution)
Replacing debugger with breakpoints
I will start the first task by removing all of the
debugger statements from tic-tac-toe.browser.test.tsx:import { page } from '@vitest/browser/context'
import { render } from 'vitest-browser-react'
import { TicTacToe } from './tic-tac-toe.js'
test('places cross marks in a horizontal line', async () => {
render(<TicTacToe />)
await page.getByRole('button', { name: 'left middle' }).click()
debugger
await page.getByRole('button', { name: 'middle', exact: true }).click()
debugger
await page.getByRole('button', { name: 'right middle' }).click()
debugger
const squares = page.getByRole('button').elements().slice(3, 6)
expect(squares.map((element) => element.textContent)).toEqual(['✗', '✗', '✗'])
})
Because I still want to be able to debug those steps, I will add breakpoints to replace those
debuggers using my IDE: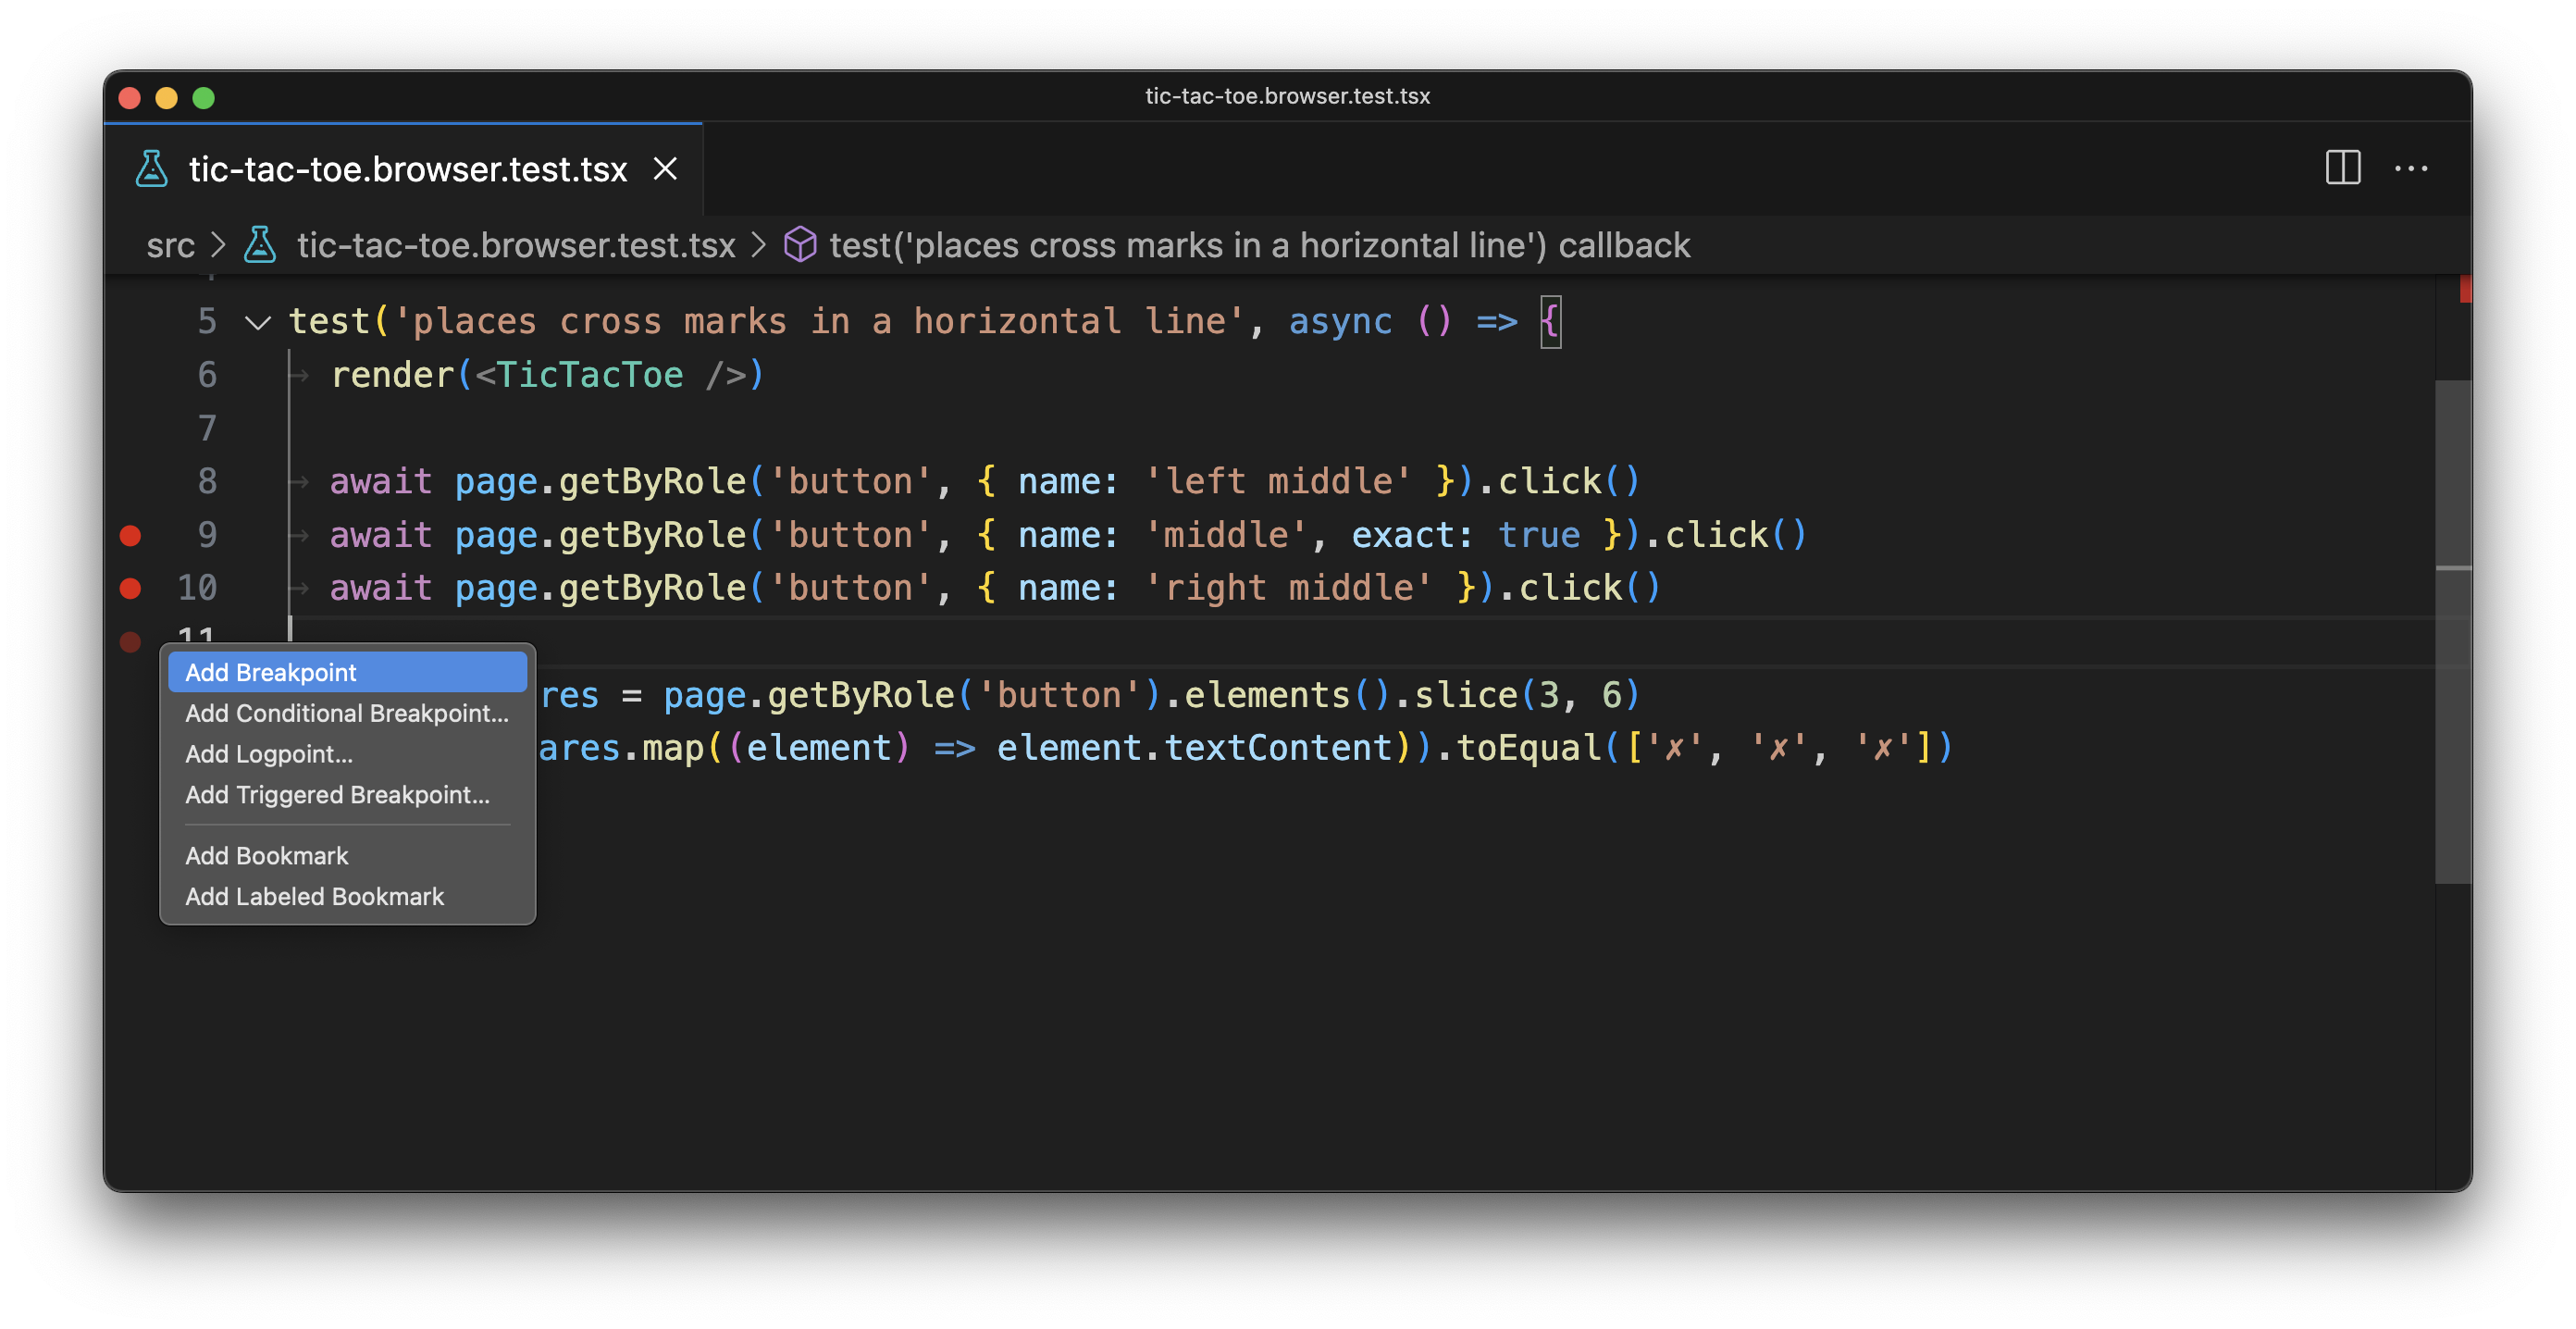
🦉 You can use both your IDE and the "Source" panel in your browser to add breakpoints, even if your code is already running. That will keep your source code clean and give you more power and flexibility compared todebugger.
Conditional breakpoints
Speaking of more powers, it's time to put them to good use! But not before I finish the new test case for the
<MainMenu /> component.As the name suggests, the menu component renders the main navigation for our application. To do that, it recursively iterates over the
menuItems array to render those items and their possible children. This is, effectively, a loop with a base case and a recursive case:{
props.items.map((item) => (
<li key={item.url}>
<NavLink to={item.url}>{item.title}</NavLink>
{item.children ? (
// Recursive case
<MenuItemsList items={item.children} />
) : // Base case.
null}
</li>
))
}
But for some unknown reason, when I run the automated test, the link I expect to be active isn't the only one active!
 ❯ src/main-menu.browser.test.tsx:22:39
     20|  )!
     21|
     22|  await expect.element(currentPageLink).toHaveAccessibleName('Analytics')
       |                                       ^
     23| })
     24|

Caused by: Error: expect(element).toHaveAccessibleName()

Expected element to have accessible name:
  Analytics
Received:
  Dashboard
Something is definitely off here, and I can use breakpoints to help me find the root cause.
There's just a slight problem. Since the
<MainMenu /> component is recursive, if I put a breakpoint where I think is a good place to start debugging, it will trigger for all rendered menu items. That's not nice because I will be spending my time jumping between breakpoints instead of actually solving the issue.This is where conditional breakpoints can be a huge time-savior. They act just like the regulat breakpoints but they only trigger when their condition resolves to true. So I can say if
item.title === 'Dashboard', stop the execution. That's neat!But not so fast. Conditional breakpoints can only access variables present in the current scope (i.e. the scope where you are placing a breakpoint), and the
item variable comes from the parental scope, which will make it impossible to use in the condition.function MenuItemsList({ items }: { items: Array<MenuItem> }) {
return (
<ul className="ml-4">
{items.map((item) => {
return (
<li key={item.url}>
<NavLink
to={item.url}
className={({ isActive }) =>
[
'px-2 py-1 hover:text-blue-600 hover:underline',
// I'd like to put a conditional breakpoints somewhere here,
// but the `item` variable isn't defined or referenced in this scope.
isActive ? 'font-bold text-black' : 'text-gray-600',
].join(' ')
}
>
{item.title}
</NavLink>
{item.children ? <MenuItemsList items={item.children} /> : null}
</li>
)
})}
</ul>
)
}
Luckily, I can fix this by referencing the
item inside the className function's scope: <NavLink
to={item.url}
className={({ isActive }) =>
[
'px-2 py-1 hover:text-blue-600 hover:underline',
isActive ? 'font-bold text-black' : 'text-gray-600',
// Referencing the `item` variable in this closure will make it
// possible to use for the conditional breakpoint.
item && isActive ? 'font-bold text-black' : 'text-gray-600',
].join(' ')
}
>
This change won't affect the class name condition but instead will expose theitemvariable to this closure.
Now, I can add a conditional breakpoint in Visual Studio Code by right-clicking on the gutter next to the line I need and choosing the "Add Conditional Breakpoint..." option from the context menu:
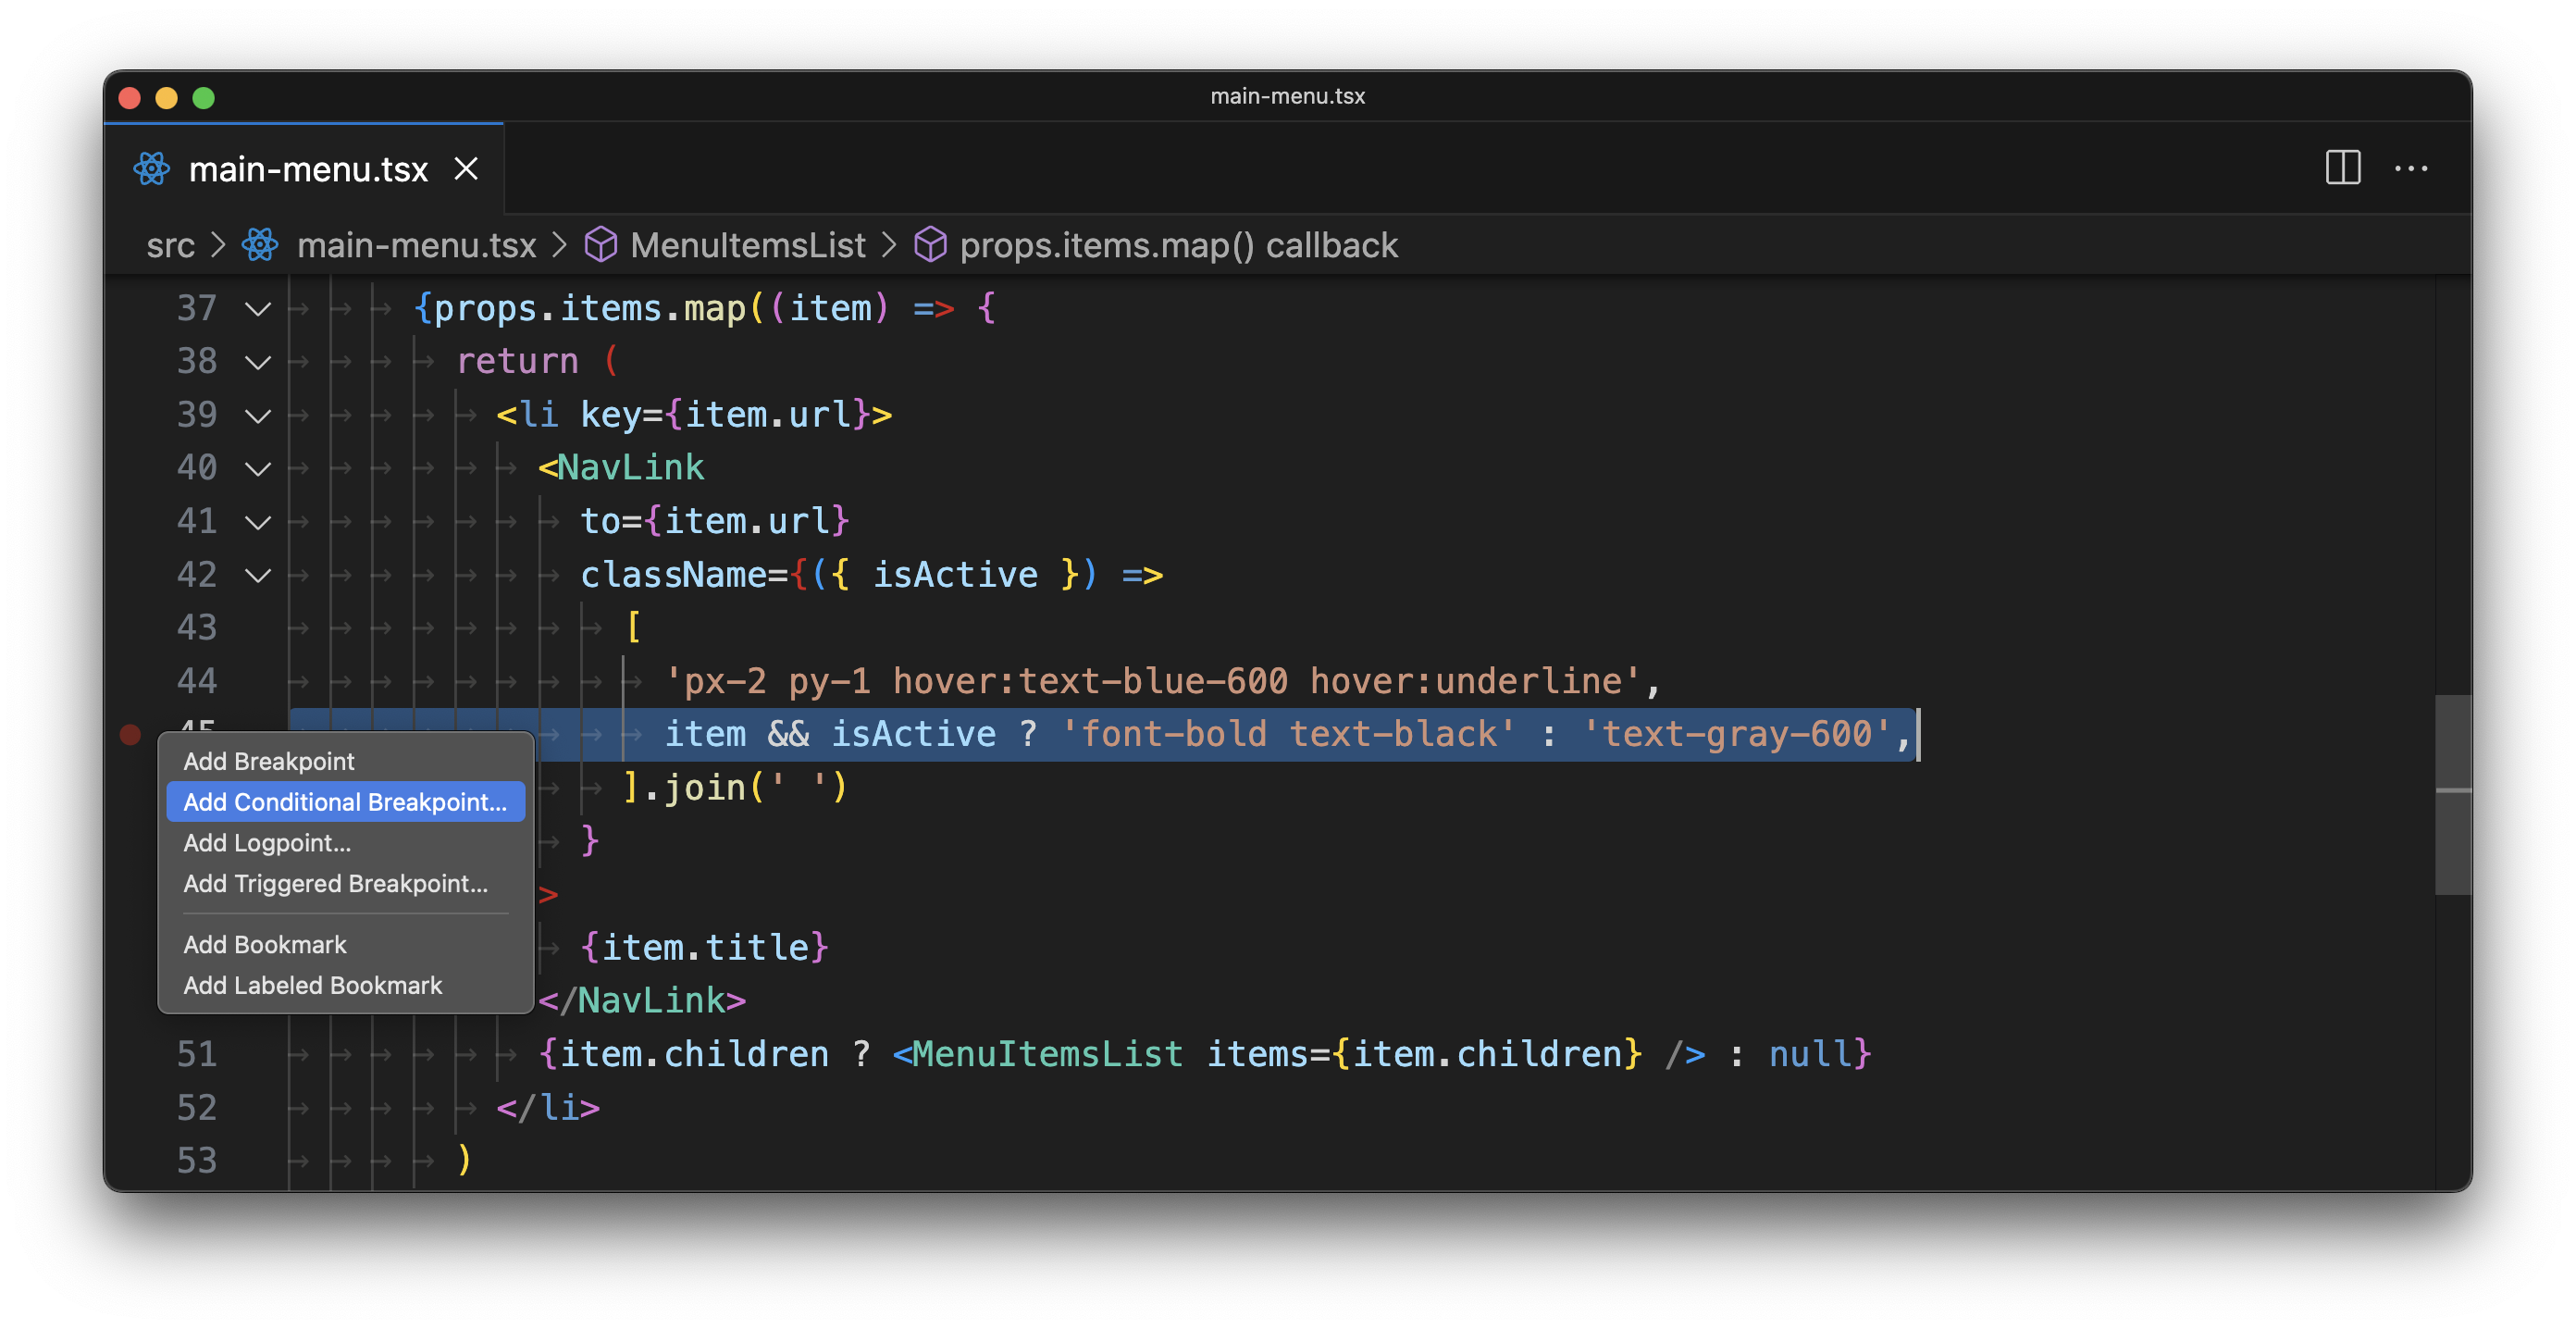
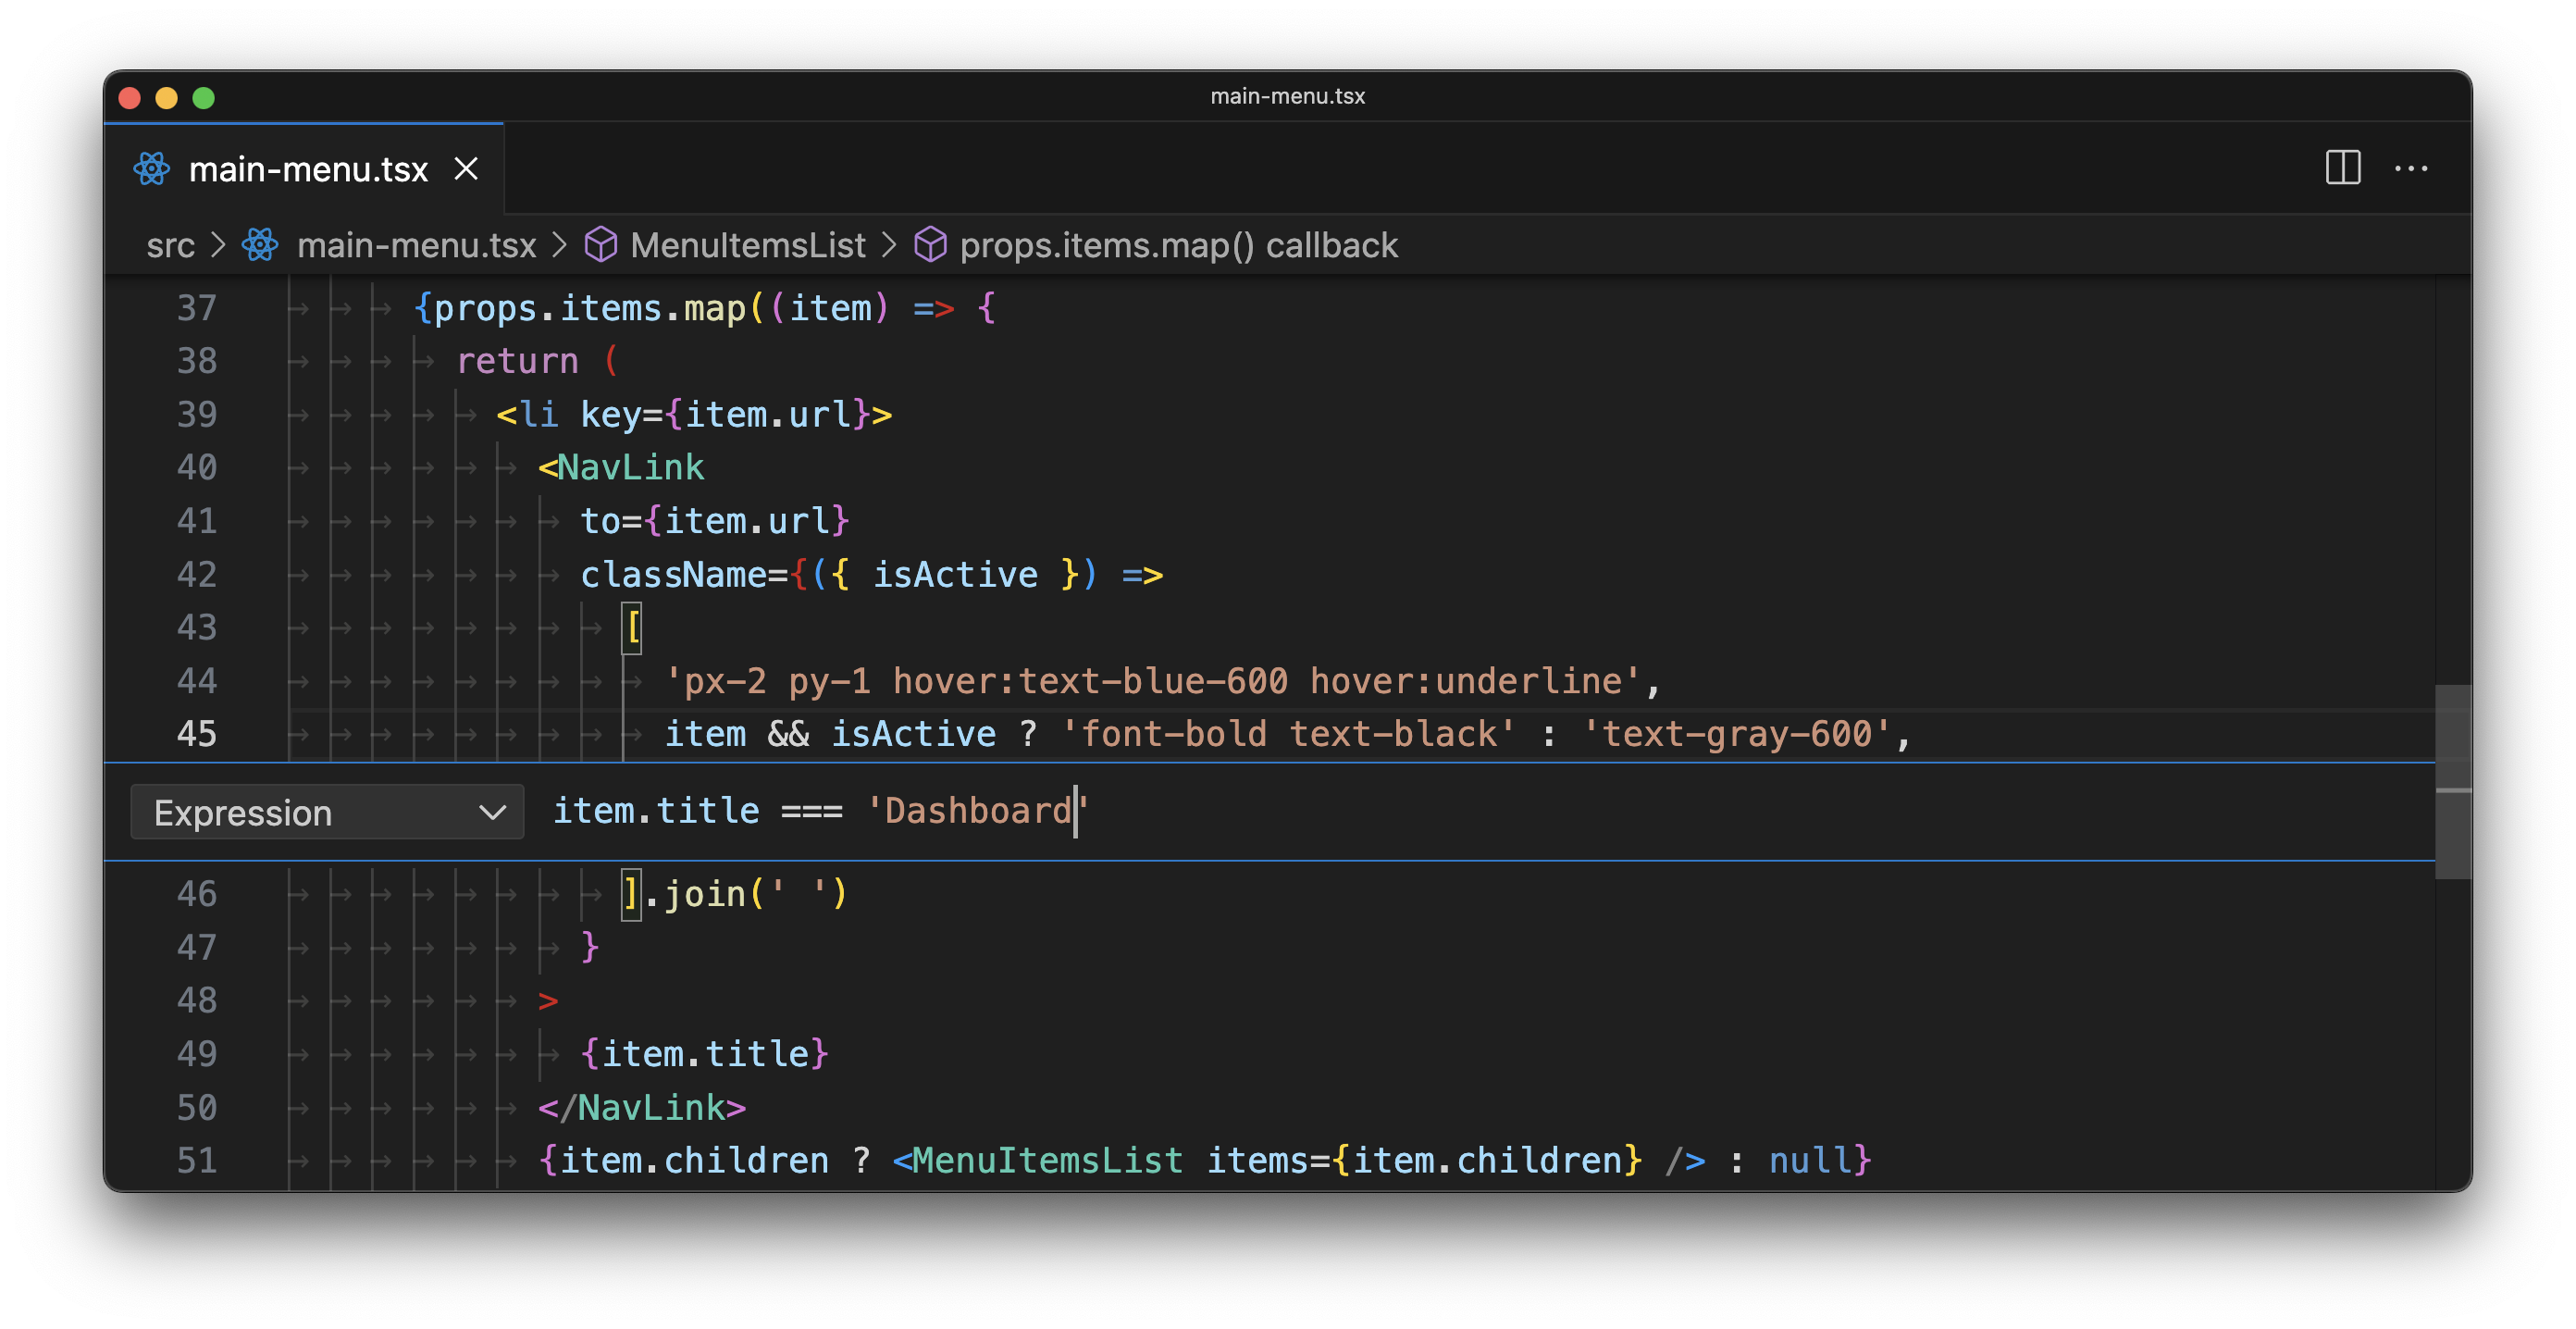
Let's run the
main-menu.browser.test.tsx test suite with the debugger attached and arrive at this breakpoint just when I mean to: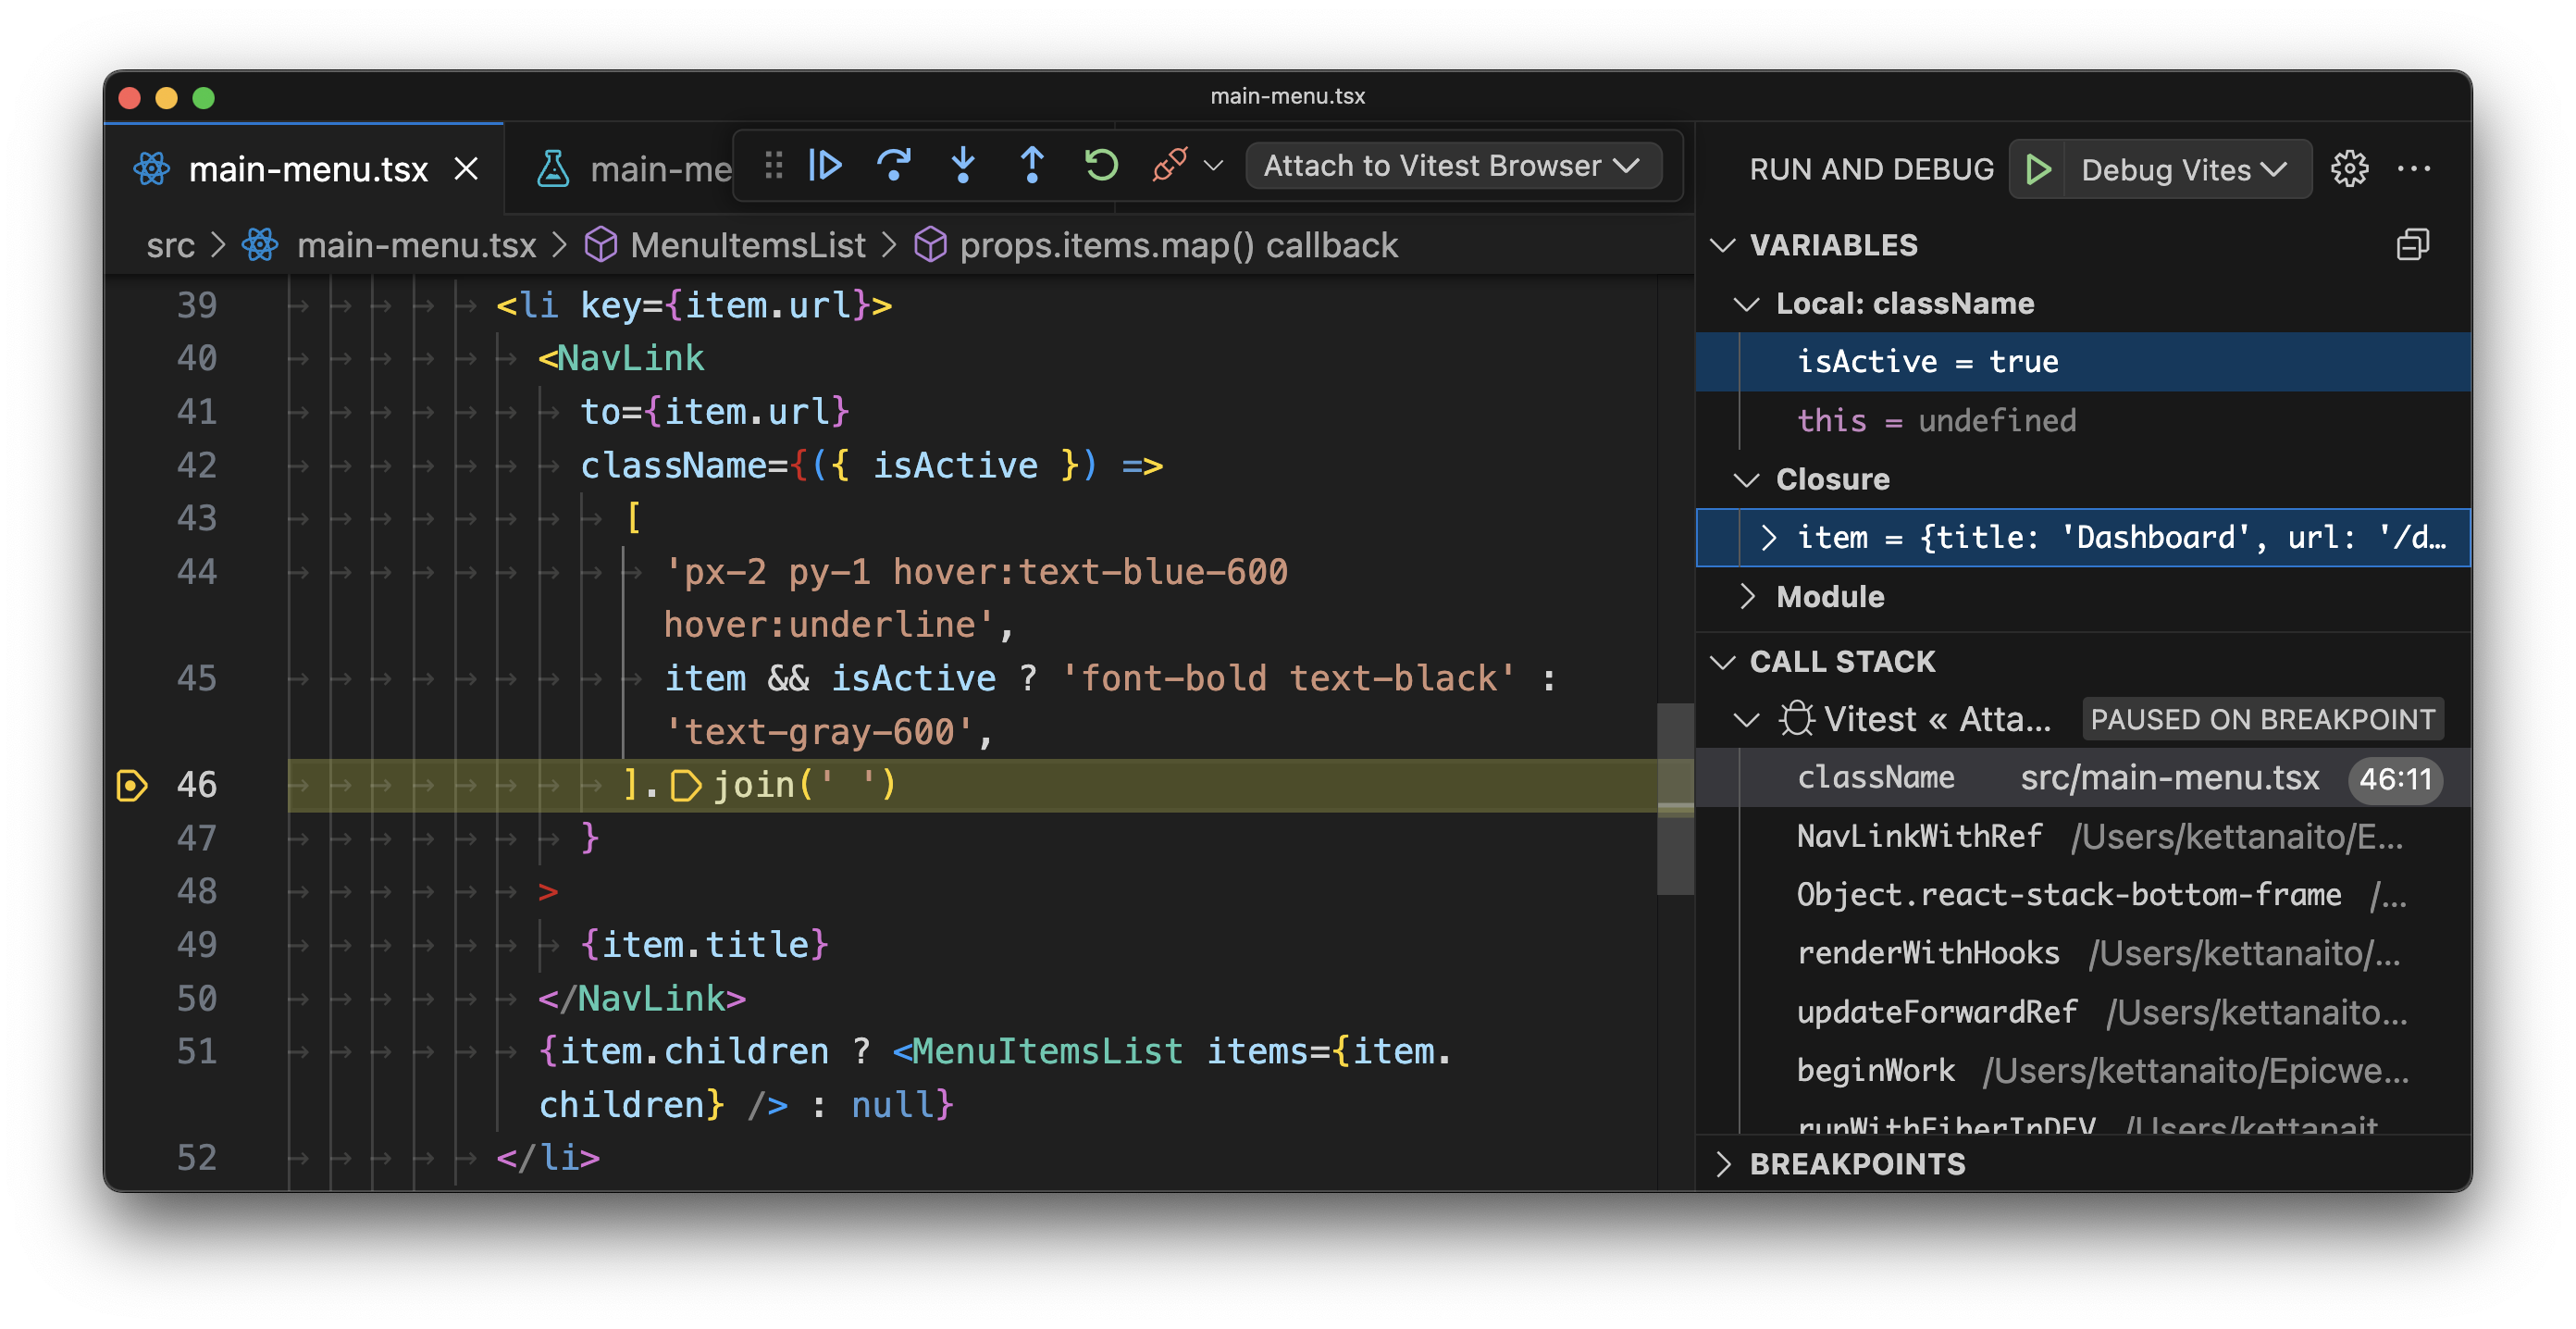
As usual, I can look around to see the
item and isActive values in this scope. Just like I suspected, the isActive prop is set to true for the Dashboard menu item. But why?The answer to that lies deeper down the stack trace. If I click on the
NavLinkWithRef frame in the stack trace, the debugger will bring me to the rendering part of NavLink from my menu. Here, I can inspect all the props that the NavLink gets but also gain access to everything in its scope.I am particularly interested in this line, where the
isActive variable gets assigned:let isActive =
locationPathname === toPathname ||
(!end &&
locationPathname.startsWith(toPathname) &&
locationPathname.charAt(endSlashPosition) === '/')
I can still see that it's
false, but having access to all the data React Router uses to compute this value, I can play around with it and, hopefully, find the root cause.I will start from inspecting the
locationPathname and toPathname values in the Debug console: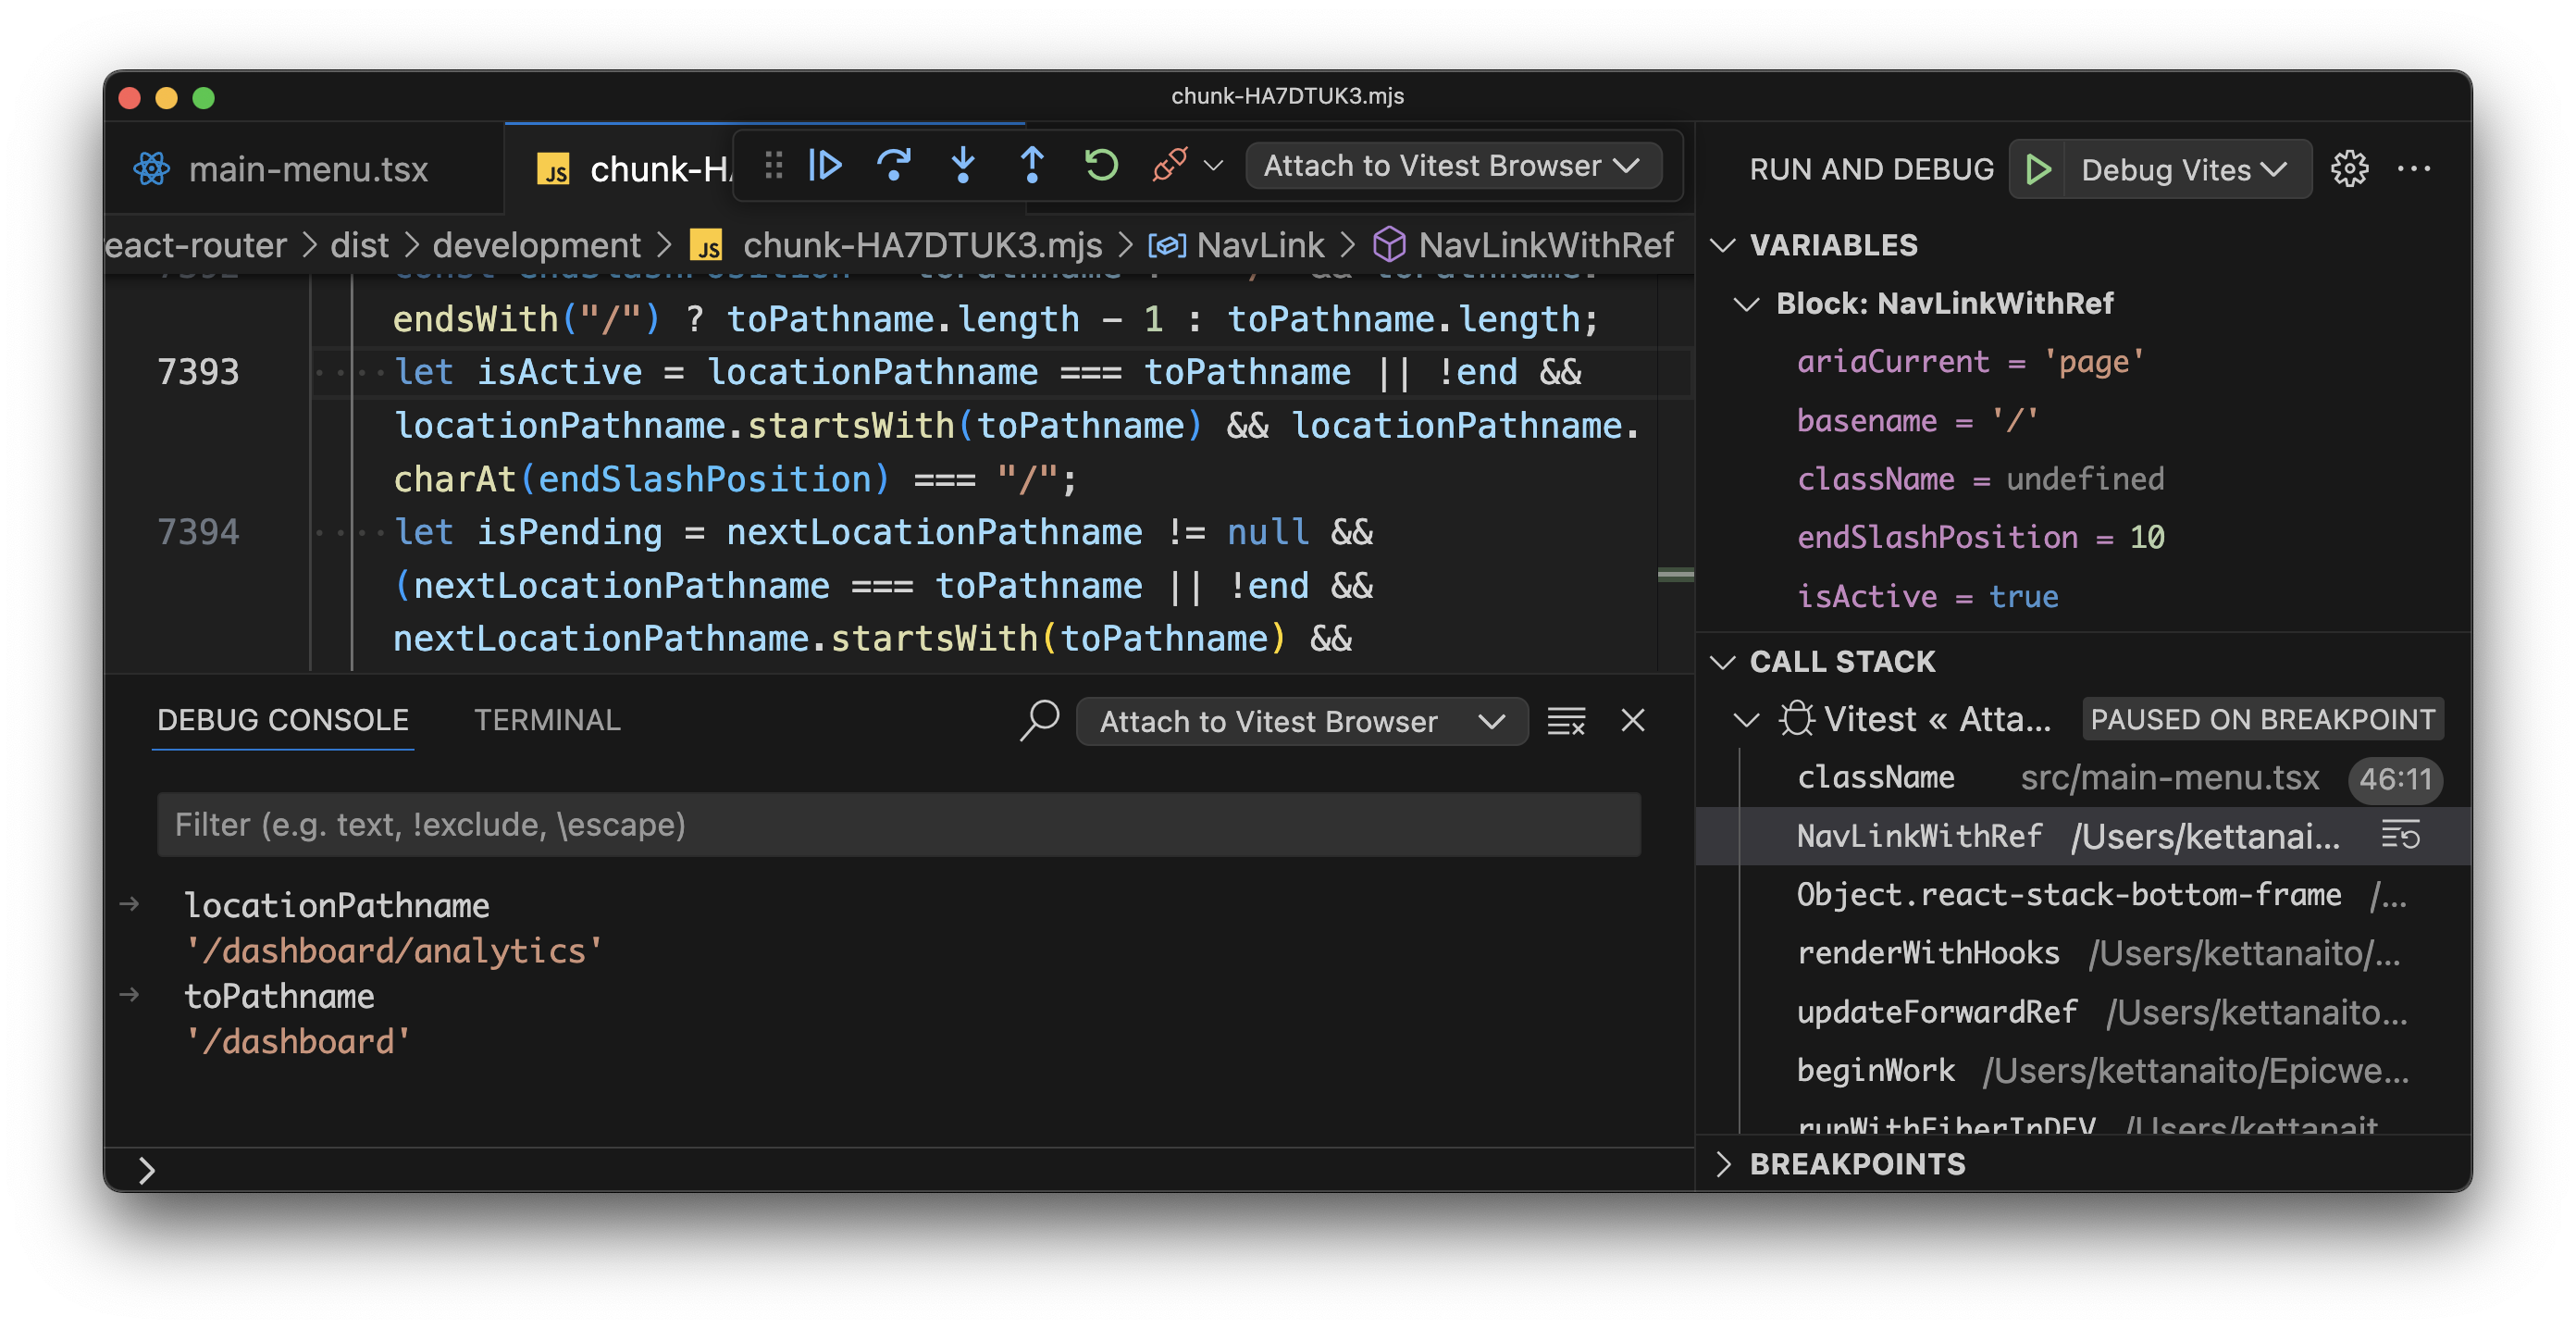
Since
locationPathname (document location) is /dashboard/analytics just like I set it in tests, it certainly doesn't equal the link's to path, which is /dashboard. The condition follows on, and now it branches based on the end prop. Once I take a peek at its value...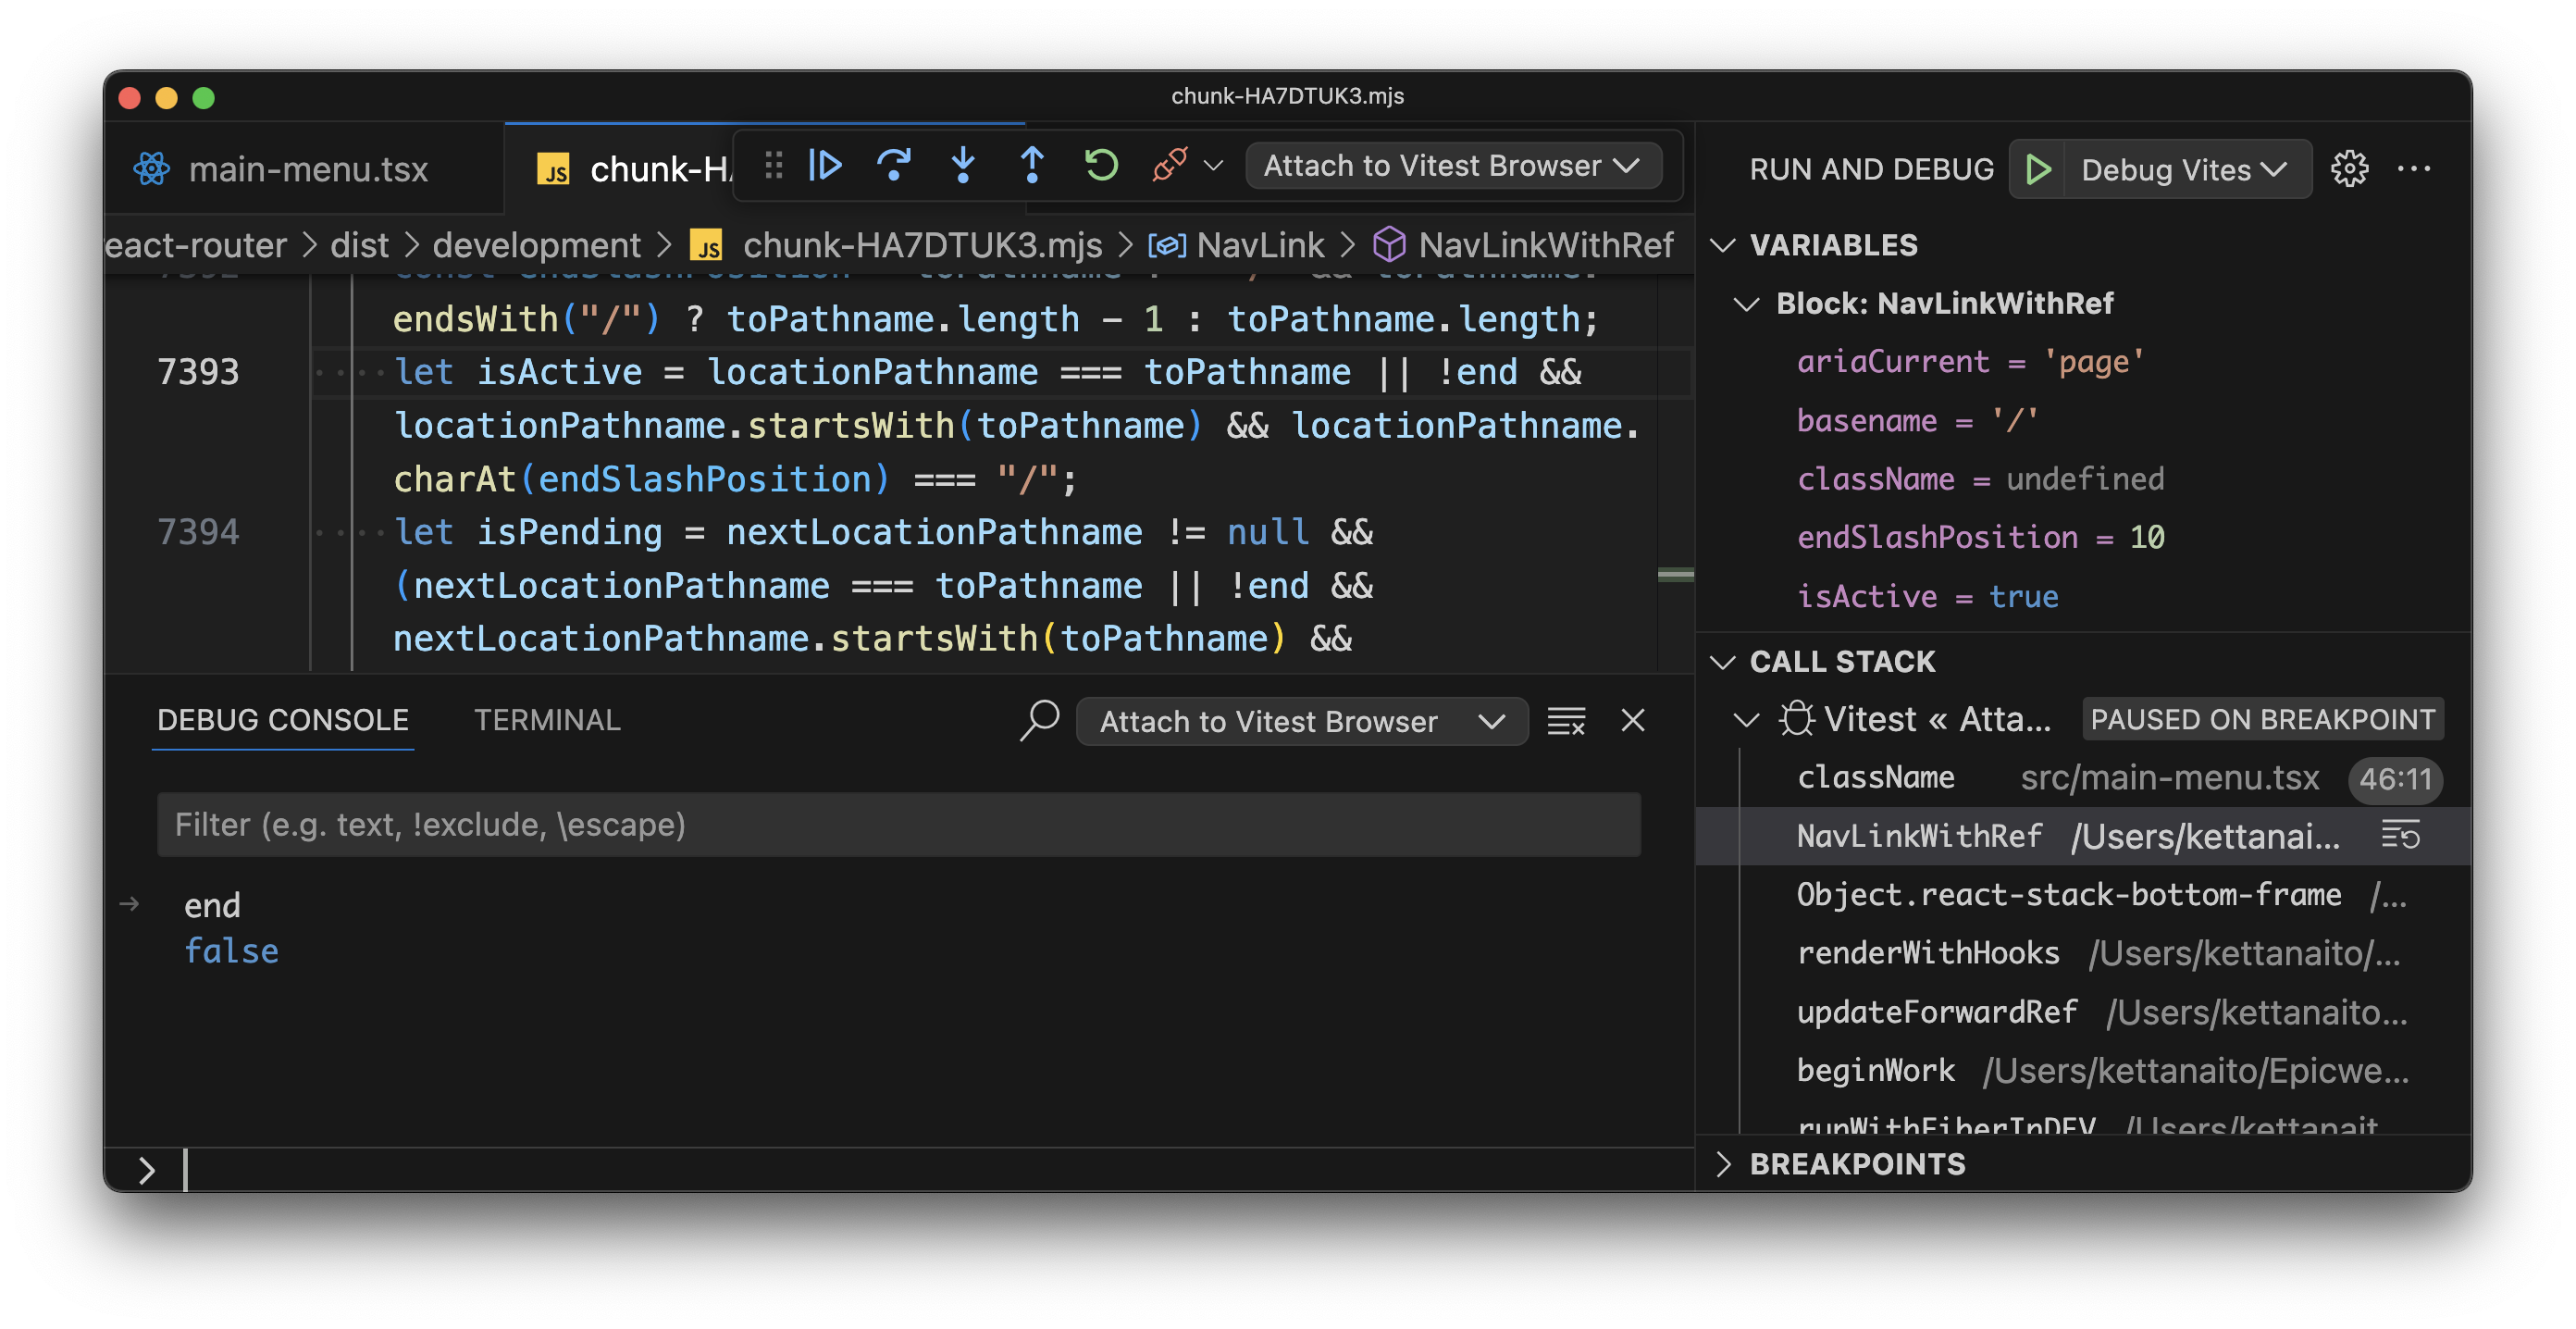
It's
false! This means that the first logical branch will resolve (the one with !end), and return true as the isActive value because current location starts from the link's path:'/dashboard/analytics'.startsWith('/dashboard')
// true
🤦 I forgot to pass
end={true} to the NavLink in my menu. Luckily, that's an easy fix: <NavLink
to={item.url}
end={true}
className={({ isActive }) =>
[
'px-2 py-1 hover:text-blue-600 hover:underline',
isActive ? 'font-bold text-black' : 'text-gray-600',
].join(' ')
}
>
Theendprop (alsoexactsometimes) forces the link to be active only if its path and the document path are identical.
With this change, the test suite is green again! 🎉
 ✓  chromium  src/main-menu.browser.test.tsx (1 test) 12ms
   ✓ renders the currently active menu link

 Test Files  1 passed (1)
      Tests  1 passed (1)
Now you know how to harness the power of conditional breakpoints to debug your React components or any JavaScript code in general. Use it wisely!