Debugger
Debugger
Let's crank it up a notch. Observing the rendered DOM is useful, but not as much as being able to step through what our test is doing. For that, we are going to need a
debugger.In JavaScript, if you place a
debugger statement anywhere in your code, the engine running that code will pause its execution and let you "look around", then proceed to the next debugger checkpoint, if you have any.function compute() {
const value = stepOne()
debugger
stepTwo(value)
}
In this example, whencompute()function is run, the code execution will stop at thedebuggerline. You will be able to observe thevalueand resume execution on demand.
This works great for debugging Node.js tests in Vitest. But when it comes to the Browser Mode, this will not be enough.
Vitest Browser Mode consists of two processes:
- A Node.js process spawning the test runner (collects tests, runs global setup);
- A browser process evaluating and running the test suites.
Adding a
breakpoint to a browser test won't do anything because you spawn the tests in Node.js (running npm test) while the debugger statement gets evaluated in a different process (the browser).But worry not, there's a neat way to connect the two!
👨💼 In this exercise, you will configure your IDE to connect to the remote debugger started by the browser process of Vitest. And it will start with a configuration file.
🐨 Create a new directory
.vscode and add a new file there called launch.json with this content:{
"version": "0.2.0",
"configurations": [
{
"type": "node-terminal",
"name": "Run Vitest Browser",
"request": "launch",
"command": "npm test -- --inspect-brk --browser --no-file-parallelism",
"env": {
"DEBUG": "true"
}
},
{
"type": "chrome",
"request": "attach",
"name": "Attach to Vitest Browser",
"port": 9229
}
],
"compounds": [
{
"name": "Debug Vitest Browser",
"configurations": ["Attach to Vitest Browser", "Run Vitest Browser"],
"stopAll": true
}
]
}
This configuration tells Visual Studio Code how to launch your application (in our case the tests) for debugging. We have two configurations defined here:
Run Vitest Browser, which will run our tests with a few special arguments:--inspect-brk, which tells Node.js to spawn a debugger process. If provided, Vitest will arrange appropriate debugging mode in your browser provider automatically;--browser, which tells Vitest to run only the browser tests/workspaces;--no-file-parallelism, which forces Vitest to run our test cases in sequence (required for the debugger to work properly).
Attach to Vitest Browser, which will attach a Chome DevTools instance exposed by the browser tests to the built-in debugger in Visual Studio Code. This will allow you to control the debugging experience directly from your IDE.
Then, we combine these two tasks to run at the same time under a single
compound task called Debug Vitest Browser.🦉 I am also setting theenv.DEBUGvariable to'true'to conditionally run the browser tests in a headless mode mode. That way, I can see what's going on on the page while debugging my tests. Take a look atto see how that environment variable is used.
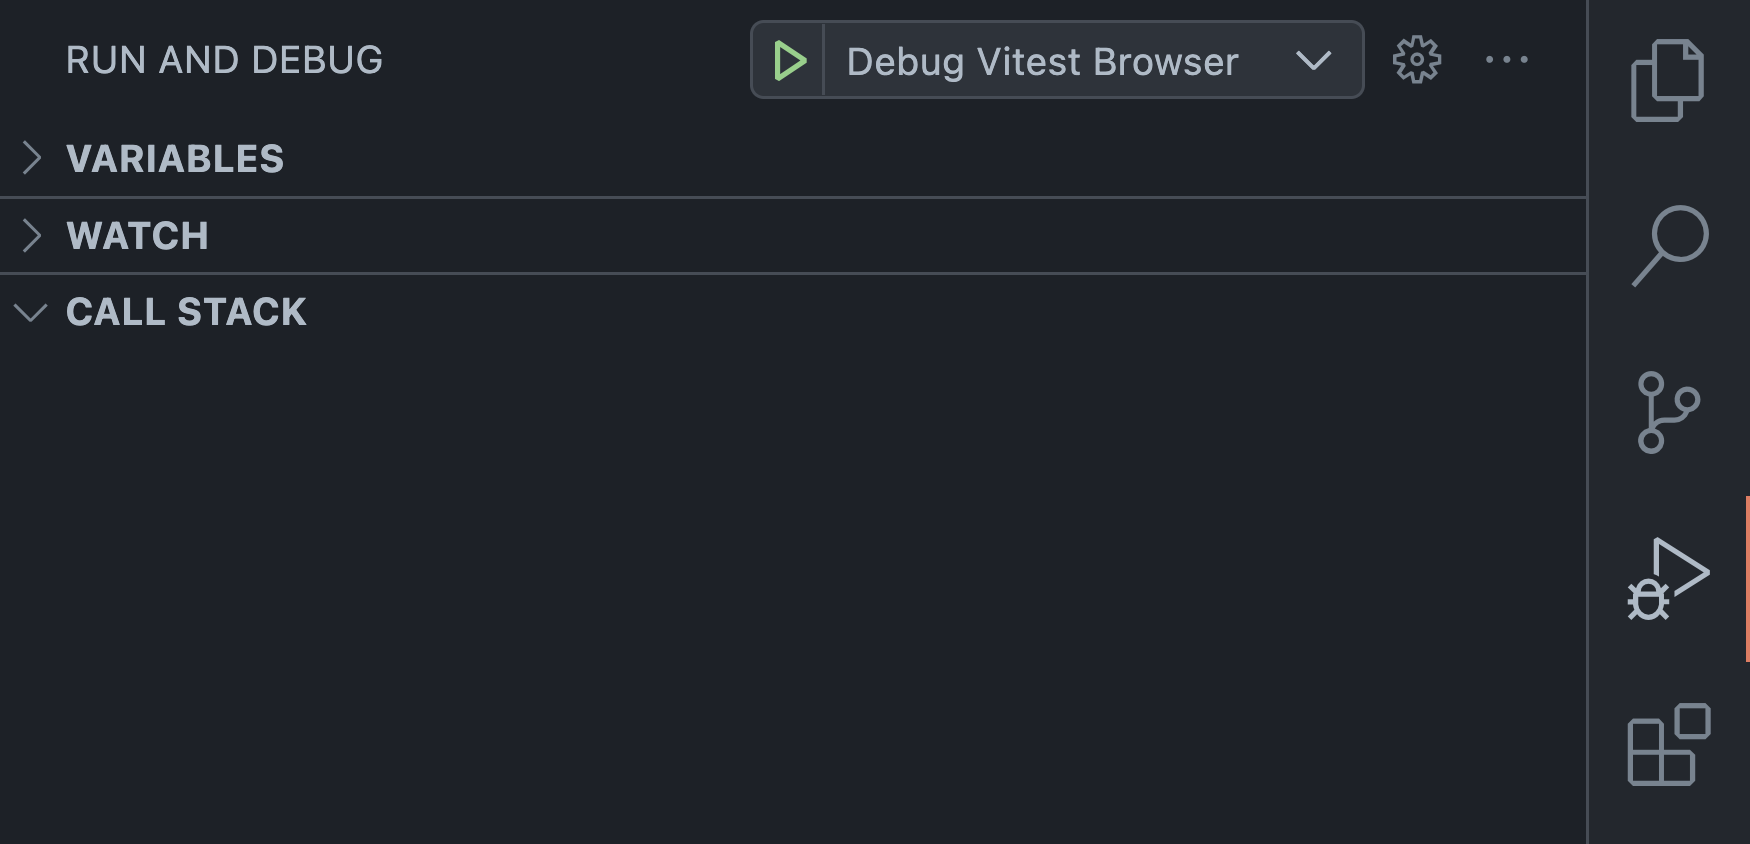
Once this is done, you can start your browser tests in a debug mode by openning the "Run and debug" window (Shift+Cmd+D) and run the "Debug Vitest Browser" task from the dropdown at the top:

🐨 Equipped with these superpowers, try debugging the issue from the previous exercise by using the
debugger statements in your test case. Remember to run your tests through the "Debug Vitest Browser" task!