Debugger
Debugger (🏁 solution)
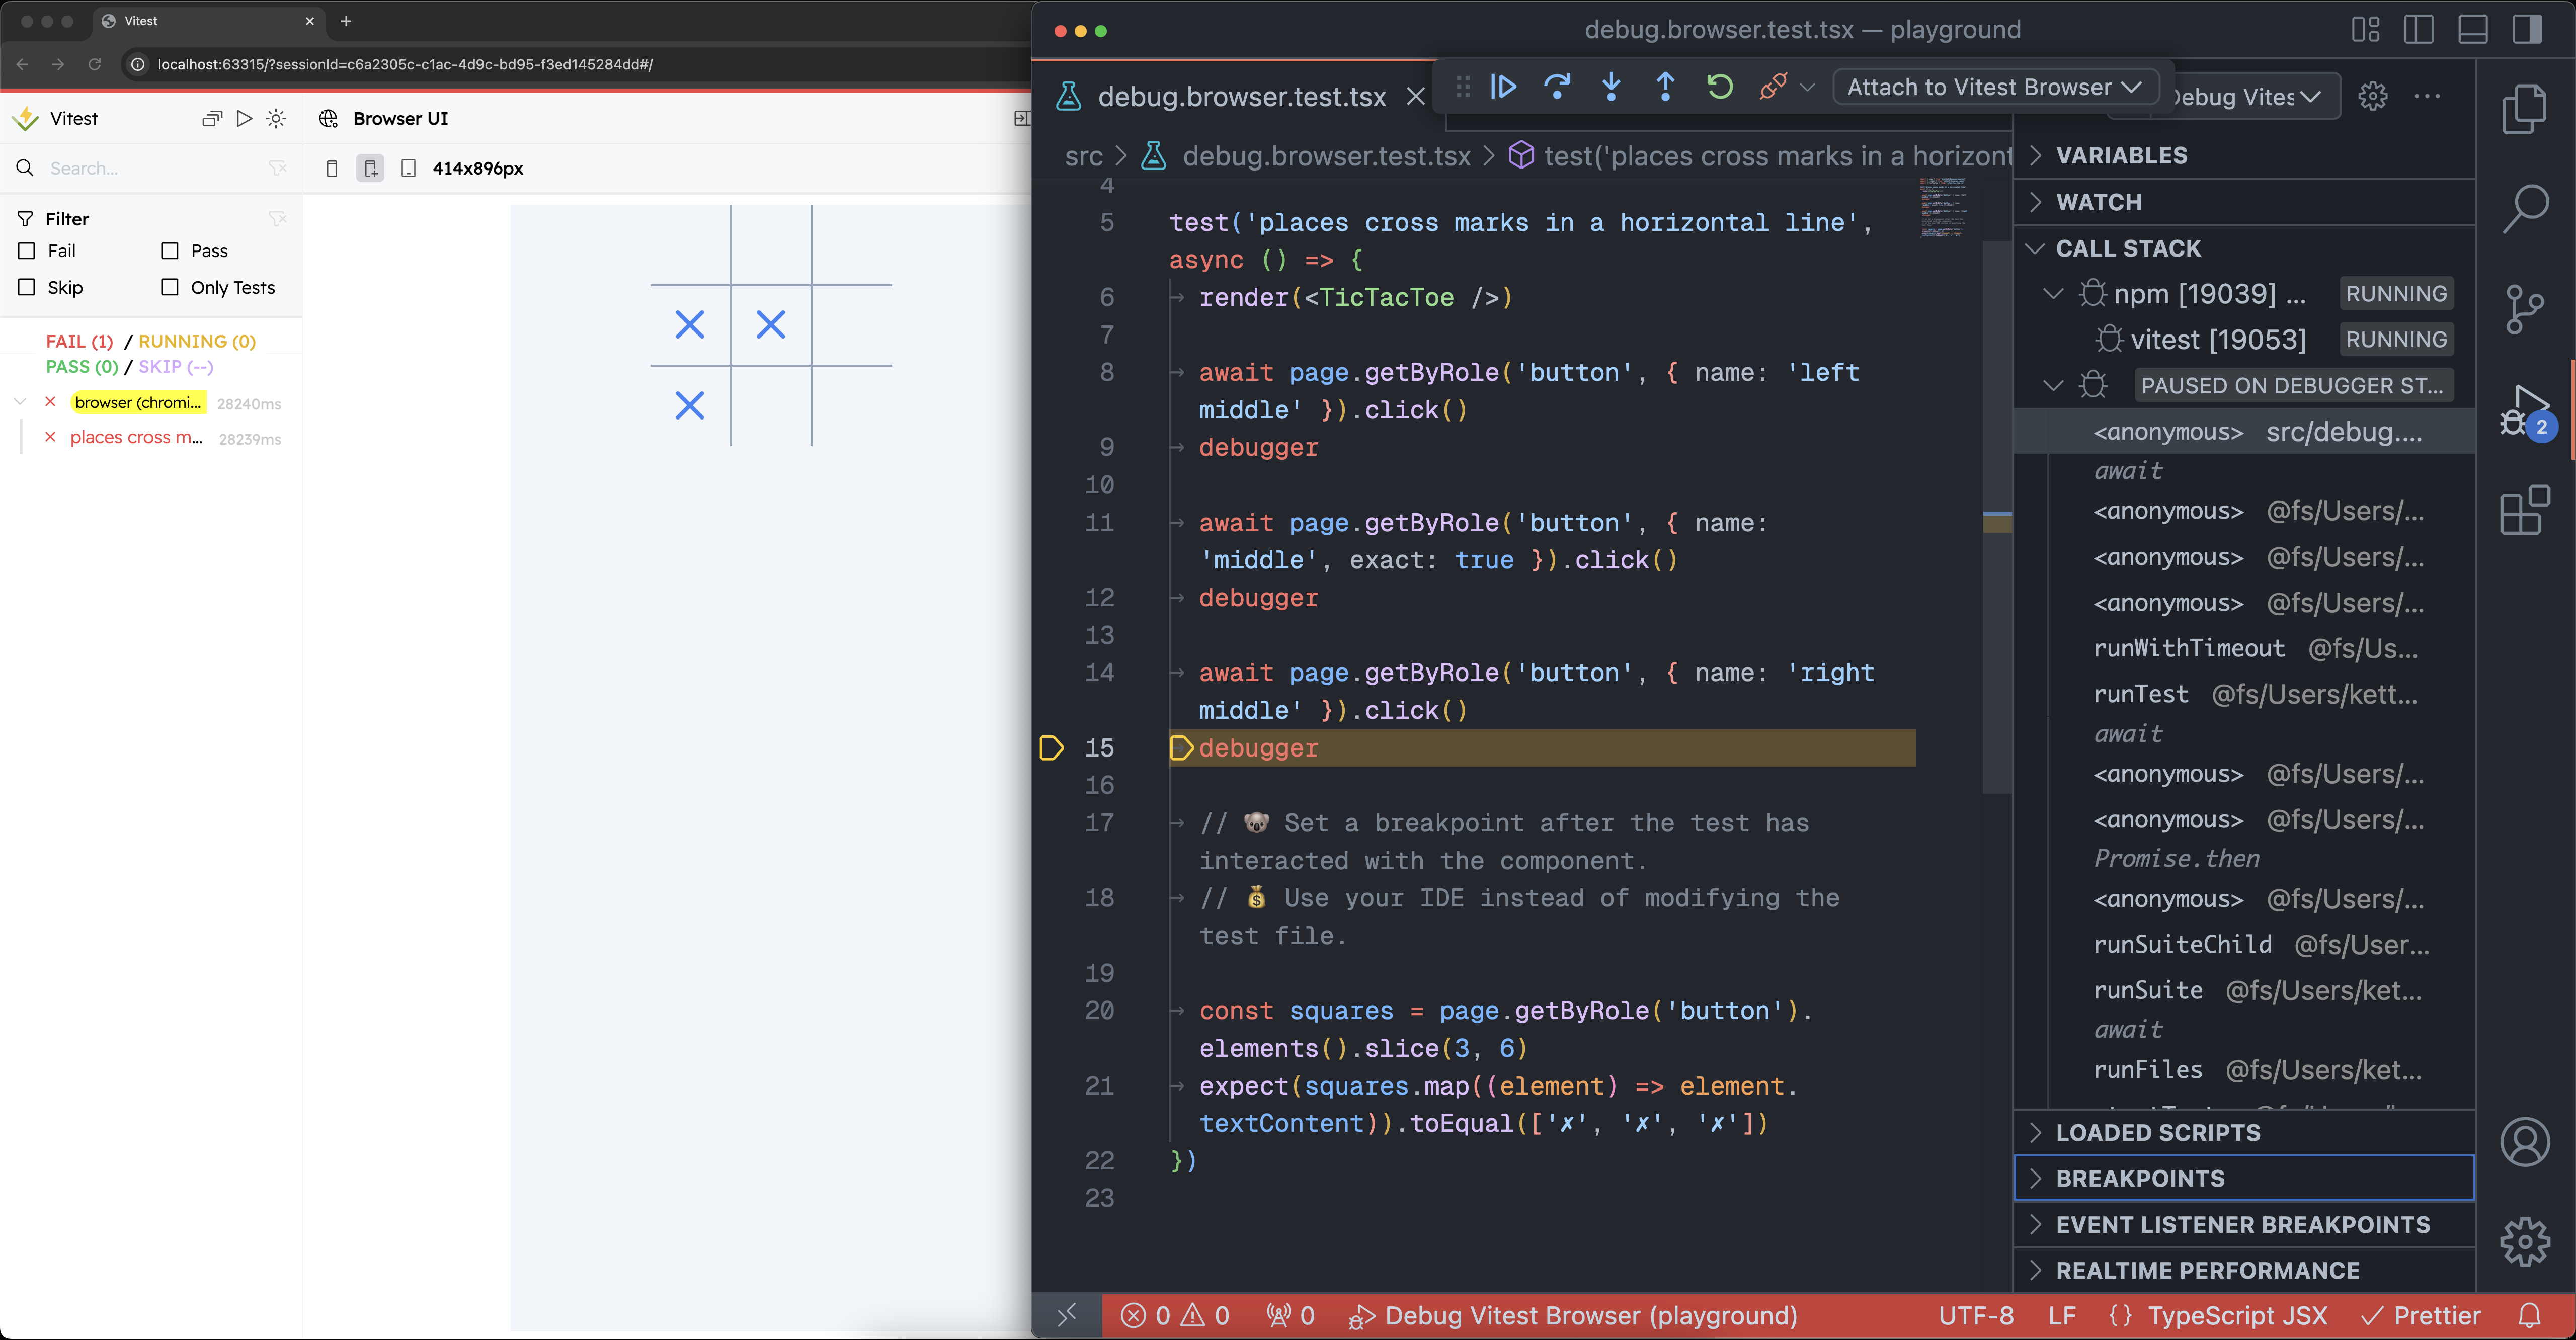
Using the debugger allows me to step through my test wherever and whenever I need to. However, it would be really helpful to pause after my test marks a cell in the
<TicTacToe /> component. I can do that by placing a debugger statement after the corresponding actions in the test:test('places cross marks in a horizontal line', async () => {
render(<TicTacToe />)
await page.getByRole('button', { name: 'left middle' }).click()
debugger
await page.getByRole('button', { name: 'middle', exact: true }).click()
debugger
await page.getByRole('button', { name: 'right middle' }).click()
debugger
const squares = page.getByRole('button').elements().slice(3, 6)
expect(squares.map((element) => element.textContent)).toEqual(['✗', '✗', '✗'])
})
Running this test via the "Debug Vitest Browser" will now stop the test execution at the
render(<TicTacToe />) step automatically. I can jump to my own breakpoint by pressing F5 or the ⏵ button in the debugging controls.
Every
debugger statement creates a breakpoint. Once the JavaScript engine reaches that breakpoint, its execution will pause until it's resumed. I can inspect the DOM, styles, JavaScript execution, and the test state as if the time has froze now!--inspect-brk vs --inspect
One more noteworthy thing are the flags we are using to create a debugging process, specifically, the
--inspect-brk flag.You may provide both
--inspect and --inspect-brk flags to Vitest, but they behave differently. --inspect-brk will make Vitest automatically add a breakpoint before every render(), while --inspect will not.What's next?
With debugging configured around our test suite, it's time to explore how you can get even more value out of your newly-found time stopping superpowers.